GraphSNP is an interactive visualisation tool running in a web browser that allows users to rapidly generate pairwise SNP distance networks, investigate SNP distance distributions, identify clusters of related organisms, and reconstruct transmission routes.
GraphSNP allows users to visualise SNP distances for investigating outbreak clusters and transmission interactively. The intuitive web application design, minimal installation and configuration steps, make it easy to use for rapid exploratory analysis. GraphSNP is freely available for both online and offline use.
The source code associated with this tool is free available from GraphSNP’s github
A demonstration version of GraphSNP is available online at graphsnp.fordelab.com and graphsnp.beatsonlab.com
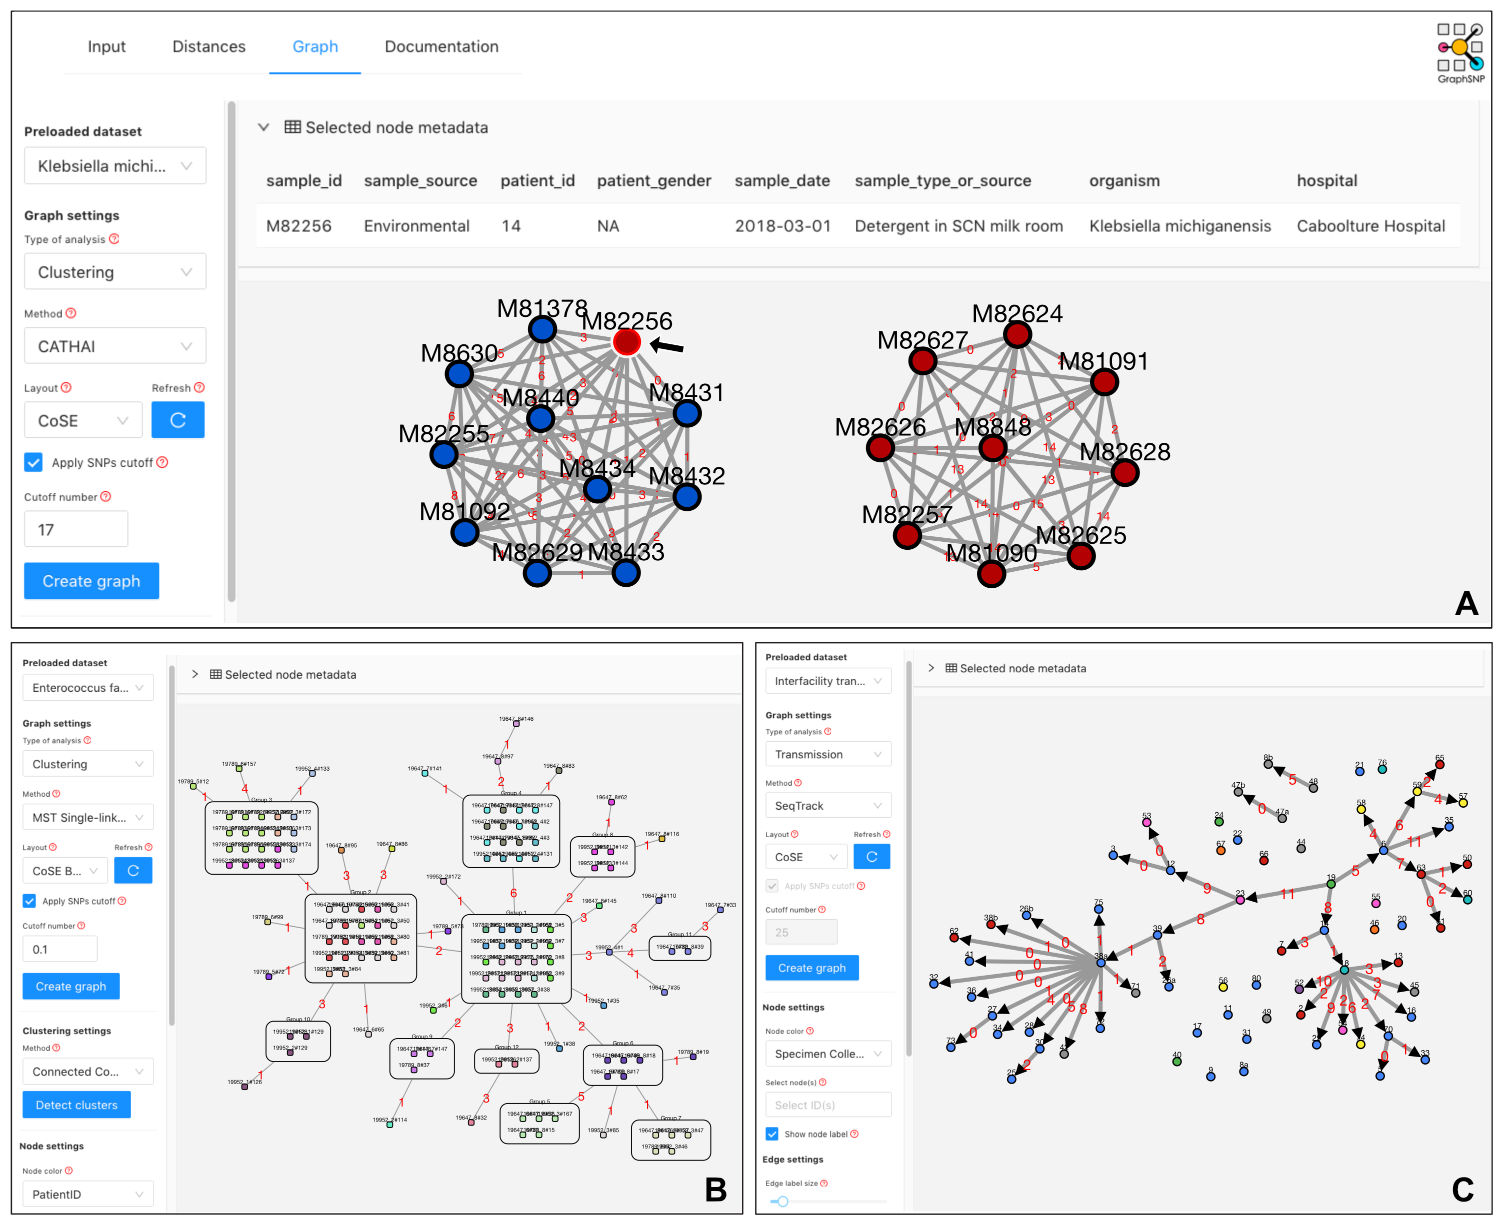 Figure: Visualisation of cluster networks, threshold-based minimum spanning tree (MST) and transmission tree in GraphSNP.
(A) Two split networks represent two clusters of ESBL-producing K. michiganensis when applying a threshold of 17 SNPs. Node colour indicates sample source. A black arrow indicates an environmental isolate causing the outbreak. (B) Threshold-based MST displays SNP distances between groups of identical samples (0 SNPs) of Vancomycin-resistant E. faecium ST78 subtype 47A. Node colour indicates patient id. (C) A transmission tree shows inter-facility transmission directions of Carbapenem-resistant K. pneumoniae based on sample SNP distance and collection timeline. Transmission links with SNP distance greater than 11 SNPs were hidden. Node colour indicates location.
Figure: Visualisation of cluster networks, threshold-based minimum spanning tree (MST) and transmission tree in GraphSNP.
(A) Two split networks represent two clusters of ESBL-producing K. michiganensis when applying a threshold of 17 SNPs. Node colour indicates sample source. A black arrow indicates an environmental isolate causing the outbreak. (B) Threshold-based MST displays SNP distances between groups of identical samples (0 SNPs) of Vancomycin-resistant E. faecium ST78 subtype 47A. Node colour indicates patient id. (C) A transmission tree shows inter-facility transmission directions of Carbapenem-resistant K. pneumoniae based on sample SNP distance and collection timeline. Transmission links with SNP distance greater than 11 SNPs were hidden. Node colour indicates location.