HAIviz is a single page visualization application designed to help infection control professionals to interactively visualize, integrate, and communicate information related with genomic epidemiological investigation at the local setting, such as hospital and other healthcare settings.
When to use
HAIviz can be useful for you when you want to:
- Visualize outbreaks on a customized local map
- Integrate transmission information with phylogeny
- Visualise location movements (e.g, patient’s ward or bed movement)
- Explore data using interactive visualisation
- Animate the occurance of the outbreak cases using interactive timeline
- Rapidly create and download genomic epidemiological related visualisation
How to use
To start using HAIviz, visit HAIviz’s website, click HAIviz App, input the required file(s) and display the relevant visualization window from the menu. Check the documentation for more instructions.
The source code associated with this tool is free available from HAiviz’s github
A demonstration version of GraphSNP is available online at haiviz.fordelab.com and haiviz.beatsonlab.com
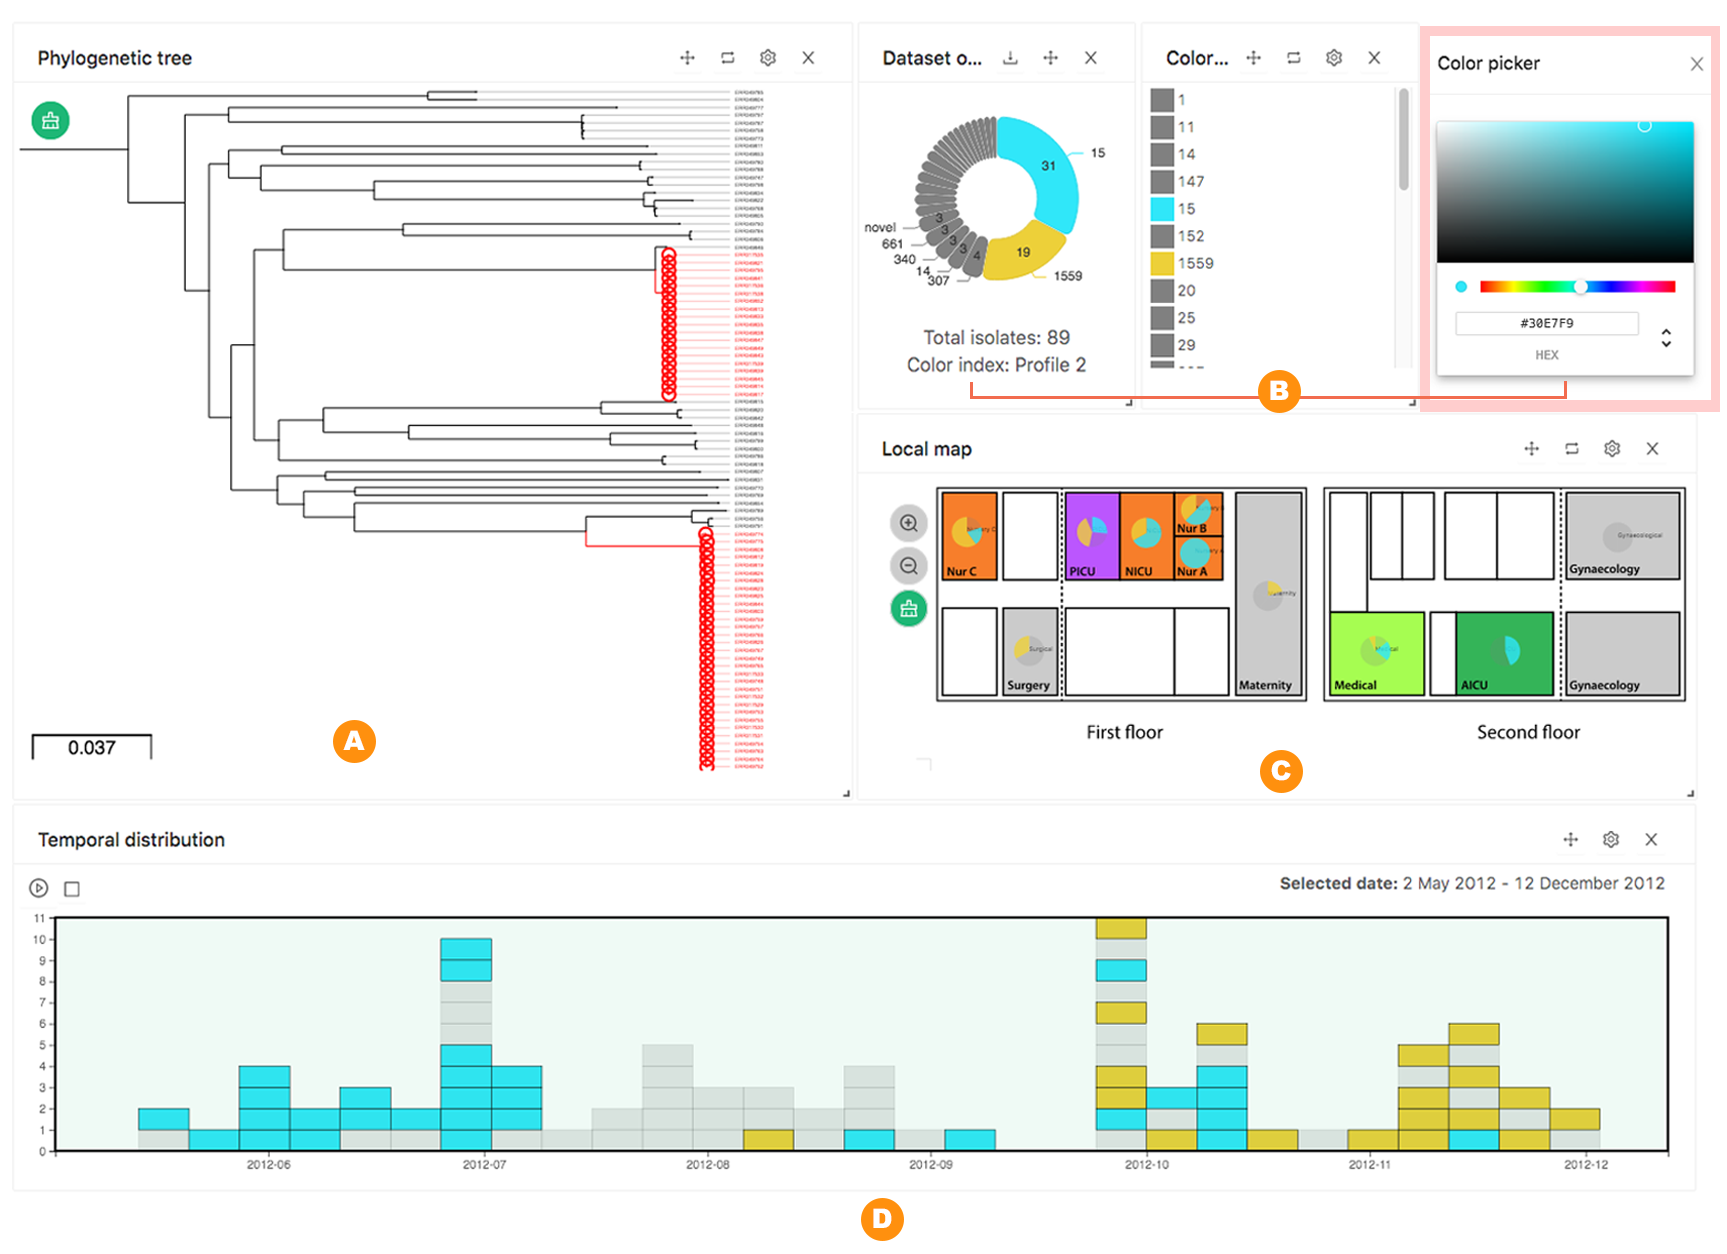 Figure: HAIviz visualises the outbreak of multidrug-resistant Klebsiella pneumonia at a major hospital in Nepal. (A) The phylogenetic tree highlights two K. pneumonia sequence type clade (ST15 and ST1559). (B) Proportion of study isolates based on the sequence type. Colour was interactively assigned using a colour picker to accentuate selected STs (ST15: blue, ST1559: yellow). (C) The hospital layout shows the composition of STs in each room. (D) A stacked bar chart displays the number of collected isolates (scaled weekly).